Table of Contents
hide
Introduction
- DFD is one of the most important system tools used for a system to develop it.
Definition
- A Data Flow Diagram (DFD) is a visual/graphical representation of how data flows within a system or process or organization.
- Data Flow Diagrams are essential tools in system analysis and design, helping to visualize and understand the flow of data through a system.
- DFD illustrates how data is processed by a system in terms of inputs and outputs, where the data comes from, where it goes, and how it is stored.
Characteristics
- It is a visual tool that can help us to understand, analyze, and document the data requirements of a system.
- It is a graphical technique used to depict and analyze the flow of data, information, and materials within a business process or system.
- DFDs are commonly used in software engineering and business analysis to model business processes, data flows, and data stores.
- DFDs can be used to analyze existing systems, identify areas for improvement, and design new systems.
- DFD can also be used to communicate system requirements and design to stakeholders and project team members.
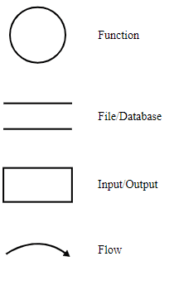
Components of DFD and Notations
- Processes/Functions:
- It is represented by circles/bubbles or rounded rectangles.
- Processes show the transformation of data from input to final or intermediate output.
- Data Stores:
- It is represented by open-ended rectangles or parallel lines.
- Data stores indicate where data is stored within the system.
- External Entities:
- It is represented by rectangles or squares.
- The external entities are sources or destinations of data outside the system being modeled.
- Data Flows:
- It is represented by the arrow symbol.
- The data flows show the direction of data movement between processes, data stores, and external entities.
Working Mechanism of DFD
- In a DFD, the system or process is represented as a set of interconnected components, such as data stores, inputs, outputs, and processes. Arrows or lines represent the flow of data between these components, and each component is labeled to indicate what it represents.
- It uses symbols to depict the entities, processes, and data stores involved in the system, as well as the data flows between them.
- A DFD consists of a set of interconnected symbols and arrows that represent the flow of data between various components of a system. The symbols used in a DFD include processes, data stores, data flows, and external entities. Processes represent activities that transform data, data stores represent where data is stored, data flows represent the movement of data between processes and data stores, and external entities represent sources or destinations of data outside the system being modeled.
- The level of detail and complexity of a DFD can vary, depending on the scope of the system being represented and the level of abstraction desired.
Types or Levels of DFD
- The number of levels of DFDs used for a particular system depends on the complexity of the system being modeled and the level of detail required to fully understand the system.
- Data flow diagrams (DFDs) can be divided into several levels or layers, each with increasing levels of detail. The different levels of DFDs are:
-
-
Context Level DFD:
- This is the highest level of DFD that shows the overall view of the system and its interactions with external entities.
- It contains only one or single process that represents the entire system and shows the external entities and the data flows between them and the system.
-
Level 0 DFD:
- Level 0 DFD is also known as the fundamental system model.
-
This level represents the main processes of the system and the data flows between them.
-
It is a more detailed view of the system than the context-level DFD.
- It expands the context diagram into more detailed processes, data stores, and data flows. It breaks down the single process of the context diagram into several subprocesses.
-
Level 1 DFD:
-
This level breaks down the processes of the level 0 DFD into more detailed sub-processes. Each sub-process represents a more detailed description of the process and shows the data flow between the sub-processes.
- It shows the functional decomposition of the system and the data flows between the sub-processes.
-
-
Level 2 DFD:
- This level of DFD further decomposes the sub-processes of Level 1 DFD into their respective sub-sub-processes. This level of DFD provides a more detailed view of the system and shows how the data flows between the sub-processes.
- It provides a more detailed view of the system processes and data flows.
-
Level 3 DFD:
-
This is practically the lowest level of DFD and provides the most detailed view of the system processes and data flows.
-
It shows the processes and data flows that make up the sub-processes of the level 2 DFD.
-
-
- The 1, 2, and 3 levels provide even more detail by breaking down processes from the previous level into smaller sub-processes. The decomposition continues until sufficient detail is provided to understand the system’s functionality.
- The different levels of DFDs allow for a progressive and detailed understanding of the system being modeled, from a high-level overview to a more granular view of the processes and data flows.
Benefits of DFD
- DFDs provide a clear and detailed representation of the system’s functionality by breaking down the system into manageable processes and showing the interactions between data stores and external entities.
- DFDs provide a clear and straightforward visual representation of data flow within a system, making it easier for stakeholders to understand system processes and interactions.
- They serve as excellent documentation tools, providing a comprehensive view of the system’s data processing.
- By visualizing data flow, DFDs help identify inefficiencies, redundancies, and potential issues within the system.
- They facilitate better communication among stakeholders, developers, and designers by providing a common visual language.
Use/Application of DFD
- Data flow diagrams are commonly used in software engineering and systems analysis to model business processes and information systems.
- DFD is useful for identifying potential bottlenecks and inefficiencies in a system, as well as for documenting and communicating how a system works.
- DFDs are useful for analyzing and designing systems, as they help to identify potential bottlenecks, redundancies, and other issues related to the flow of data.
- DFD can also be used to communicate system requirements and specifications to stakeholders, such as developers, designers, and business analysts.
- DFDs are used to visualize and analyze the movement of data through a system, making it easier to understand the system’s functionality and processes.
![]()
0 Comments